
Delivery Drivers Face a Double Threat as Dangerous Urban Roads and Insurance Gaps Raise Crash Costs
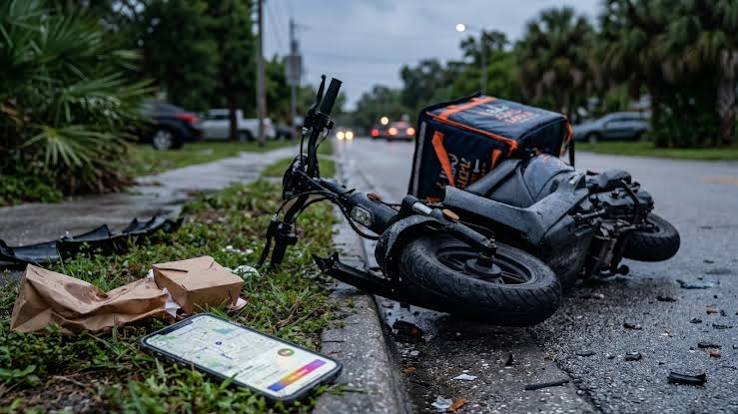
Delivery and rideshare workers face significant roadway hazards in states with elevated pedestrian and cyclist fatality rates, while insurance coverage gaps can create additional financial consequences when crashes occur during app-based work.
A nationwide study conducted by Texas Law Dog identified a strong connection between dangerous conditions for vulnerable road users and the states where gig and delivery drivers face the highest overall roadway risk.
Nine of the 10 highest-risk jurisdictions in the study also ranked among the nation’s 10 highest for pedestrian fatality risk.
Seven appeared among the highest for pedalcyclist fatalities.
The findings come as home delivery and app-based transportation increasingly rely on cars, motorcycles, bicycles and electric bikes operating in crowded urban environments.
Nationwide, federal crash records show that 7,080 pedestrians and 1,103 pedalcyclists died in traffic crashes during 2024.
Although those fatalities cannot be attributed specifically to gig or delivery workers, they demonstrate the dangers present on roads where delivery drivers and riders frequently operate.
The study also highlighted financial risks associated with occupational crashes, including situations in which personal insurance policies may not cover driving performed for commercial purposes.
Pedestrian Fatality Rates Are Elevated Across the Highest-Risk States
The research found a substantial overlap between its overall Gig & Delivery Driver Road Risk Index and fatal pedestrian crash rates.
Nine of the 10 highest-ranked jurisdictions also appeared among the national leaders for pedestrian fatalities.
New Mexico recorded the highest pedestrian fatality rate at 4.225 deaths per 100K residents.
The state ranked sixth overall in the gig and delivery road risk index.
Louisiana ranked fourth overall and third nationally for pedestrian risk.
Arizona, which led the entire index, ranked fifth for pedestrian risk and fourth for cyclist risk.
States With Notable Vulnerable Road-User Risks
| State | Overall Gig and Delivery Risk Rank | Notable Roadway Risk Indicator |
| Arizona | 1 | 5th for Pedestrian Risk; 4th for Cyclist Risk |
| Nevada | 2 | 5th for Urban Roadway Risk |
| South Carolina | 3 | 7th for Pedestrian Risk; 3rd for Cyclist Risk |
| Louisiana | 4 | Highest Pedalcyclist Fatality Rate |
| Florida | 5 | 6th for Pedestrian Risk; 2nd for Cyclist Risk |
| New Mexico | 6 | Highest Pedestrian Fatality Rate |
| Texas | 9 | 13th for Pedestrian Risk; 25th for Cyclist Risk |
The findings demonstrate how road environments with elevated pedestrian and cyclist fatalities frequently overlap with areas where gig and delivery work presents substantial exposure.
For delivery workers, interactions with pedestrians and cyclists can occur repeatedly throughout a shift.
Drivers must navigate pickup areas, curbside parking, intersections and residential streets while monitoring other vehicles and locating delivery destinations.
However, the study’s rankings measure broader roadway danger rather than direct collision rates involving delivery workers.
They therefore identify potentially hazardous operating environments without establishing that gig drivers caused the recorded pedestrian or cyclist fatalities.
Louisiana Leads the Nation in Cyclist Fatality Risk
Louisiana recorded the highest pedalcyclist fatality rate in the nationwide index, at 0.957 deaths per 100K residents.
Despite ranking only 33rd for gig and delivery work exposure, Louisiana placed fourth overall.
The disparity demonstrates how dangerous roadway conditions can elevate a state’s risk score even when its relative concentration of delivery-related businesses is lower.
New Mexico presented a similar pattern.
The state ranked 40th for occupational exposure but sixth overall because of elevated roadway fatality measures.
Its pedestrian fatality rate of 4.225 per 100K residents was the highest nationally.
These findings suggest that traffic safety challenges cannot be assessed exclusively through the size of the delivery workforce.
A state may have fewer delivery-related businesses but still expose workers to dangerous intersections, high-speed roadways and conditions associated with elevated pedestrian or cyclist fatalities.
Urban Roadway Fatalities Are Another Major Concern
Urban roadway danger emerged as another recurring characteristic among the highest-risk states.
Seven of the 10 leading jurisdictions also ranked among the 10 highest for urban roadway fatality risk.
Those jurisdictions included Arizona, Nevada, South Carolina, Louisiana, New Mexico, Washington, D.C., and Texas.
Arizona recorded the highest urban roadway fatality rate nationally, at 1.560 deaths per 100 million urban vehicle miles traveled.
Texas recorded a rate of 1.179, compared with a national median of approximately 1.007.
Urban and Vulnerable Road-User Fatality Indicators
| Geographic Area | Risk Indicator | Reported Rate |
| Arizona | Urban Roadway Deaths per 100 Million Urban Vehicle Miles | 1.560 |
| Texas | Urban Roadway Deaths per 100 Million Urban Vehicle Miles | 1.179 |
| National Median | Urban Roadway Deaths per 100 Million Urban Vehicle Miles | 1.007 |
| New Mexico | Pedestrian Deaths per 100K Residents | 4.225 |
| Texas | Pedestrian Deaths per 100K Residents | 2.438 |
| Louisiana | Pedalcyclist Deaths per 100K Residents | 0.957 |
Urban areas can present numerous challenges for workers making frequent deliveries.
Congestion, turning vehicles, roadside parking and intersections create opportunities for conflicts between motorists and vulnerable road users.
Delivery workers may encounter these conditions repeatedly while traveling between restaurants, stores and residential destinations.
The combination of high occupational exposure and elevated urban roadway fatality rates can therefore be particularly concerning.
However, the index does not establish that urban delivery activity independently increases crash rates or causes the fatalities represented in the underlying data.
New York City’s Delivery Economy Illustrates the Growing Role of E-Bikes
The rapid expansion of bicycle and electric-bike delivery has added another dimension to urban traffic safety.
New York City has more than 65,000 app-based delivery workers who rely on electric bikes, bicycles and mopeds.
These workers operate across busy streets, frequently making pickups and deliveries in areas with substantial pedestrian and vehicle traffic.
Electric-bike safety has become an increasingly important consideration.
According to New York City transportation data, 76% of cycling fatalities recorded in the city in 2023 involved electric bikes.
That statistic includes all cycling fatalities in the city, not exclusively those involving delivery workers.
The finding nevertheless demonstrates the substantial role of electric bikes in the city’s cycling fatality burden.
Electric-bike riders may encounter hazards involving turning vehicles, intersections, inadequate bicycle infrastructure and conflicts near loading areas.
Delivery work can introduce additional operational demands, including frequent stops, changing routes and navigating unfamiliar destinations.
Infrastructure improvements that separate cyclists from motor vehicles and reduce conflicts at intersections may help address some of these hazards.
Texas Recorded Hundreds of Pedestrian and Cyclist Deaths in 2024
Texas presents a particularly important example of how dangerous roadway conditions affect states with substantial delivery activity.
The state ranked ninth overall in Texas Law Dog’s Gig & Delivery Driver Road Risk Index.
Its pedestrian fatality rate was 2.438 deaths per 100K residents, placing Texas 13th nationally for that measure.
The state ranked 25th for pedalcyclist risk.
Federal Fatality Analysis Reporting System records identified 763 pedestrian deaths and 79 pedalcyclist deaths in Texas during 2024.
The Texas Department of Transportation reported slightly different totals, recording 772 pedestrian fatalities and 80 pedalcyclist deaths.
Texas Pedestrian and Cyclist Fatalities, 2024
| Road-User Category | NHTSA FARS | TxDOT |
| Pedestrians | 763 | 772 |
| Pedalcyclists | 79 | 80 |
| Combined | 842 | 852 |
The differences reflect separate reporting sources and should not be interpreted as additional fatalities.
Texas Law Dog used the federal FARS figures in its nationwide index to maintain consistency across states.
TxDOT identified driver inattention, speeding and failure to yield among important contributing factors in pedestrian and bicycle crashes.
These behaviors are particularly relevant to environments involving frequent turning movements and interactions between motor vehicles and vulnerable road users.
The findings also demonstrate why state roadway safety comparisons require consistent data sources.
Delivery Workers Can Face Substantial Personal Costs After Crashes
Beyond physical injuries, financial consequences represent another major concern for gig and delivery workers.
Research from Cornell University’s Worker Institute surveyed 500 app-based food-delivery workers in New York City.
The survey found that 49% had experienced a work-related crash or accident.
Among those reporting an accident, 75% indicated they had paid their medical expenses themselves.
These results highlight the potential financial consequences of occupational injuries, particularly for workers who depend on personal vehicles or bicycles to earn income.
Findings From Cornell’s Delivery Worker Survey
| Survey Measure | Reported Result |
| Delivery Workers Surveyed | 500 |
| Workers Reporting a Work-Related Crash or Accident | 49% |
| Accident-Experienced Workers Paying Their Own Medical Expenses | 75% |
The survey findings are specific to the workers studied in New York City and should not be interpreted as nationwide crash or insurance rates.
Nevertheless, they illustrate how occupational accidents can generate expenses that workers may have difficulty covering.
Potential costs can include medical treatment, vehicle repairs, lost income and replacement transportation.
For workers whose earnings depend on remaining active on delivery platforms, injuries and vehicle damage may also interrupt their ability to work.
Insurance Coverage Can Change Depending on a Driver’s App Status
Insurance coverage presents another challenge for workers using personal vehicles for paid transportation or deliveries.
The Texas Department of Insurance warns that some personal auto policies do not cover vehicles used for commercial delivery.
Drivers who fail to disclose business use may face claim denials depending on their policy terms and circumstances.
The National Association of Insurance Commissioners has also identified potential coverage gaps involving rideshare drivers who are logged into an application but have not accepted a passenger request.
Coverage may differ depending on whether a driver is waiting for an assignment, traveling to a pickup location or completing an active trip.
Potential Insurance Coverage Issues During App-Based Work
| Driver Activity | Potential Coverage Consideration |
| Personal Driving With App Off | Personal auto insurance generally applies, subject to policy terms. |
| App Online, Awaiting Assignment | Personal insurance exclusions or limited platform coverage may create gaps. |
| Order or Ride Accepted | Platform coverage may apply, depending on the company, activity and policy. |
| Active Delivery or Passenger Trip | Coverage may be broader, but limits and deductibles vary. |
| Assignment Completed | Applicable coverage may change as the driver’s working status changes. |
Insurance requirements also vary between rideshare passenger services and package or food delivery platforms.
The existence and extent of coverage depend on policy language, applicable state law and the circumstances of the collision.
For drivers working across multiple applications, determining which policy applies may become particularly complicated.
The findings highlight the importance of understanding insurance arrangements before beginning paid driving work.
Delivery Pressure Can Compound Roadway and Financial Risks
The study also examined how delivery schedules and payment incentives may influence driver behavior.
A 2026 peer-reviewed analysis of online food-delivery worker discussions identified recurring concerns about on-time performance expectations and their relationship with speeding.
The research examined 87 posts and 1,970 comments involving workers using major delivery platforms.
Some drivers described financial incentives as influencing their decisions to travel faster, while others identified speed monitoring as a deterrent.
Although these discussions do not establish the prevalence of speeding among all gig workers, they illustrate how compensation and performance expectations may influence driving decisions.
The findings are particularly relevant when combined with roadway fatality data.
Six of the 10 highest-risk jurisdictions in the Texas Law Dog index also ranked among the nation’s 10 highest for speeding-related fatality risk.
Texas, for example, recorded a speeding fatality rate of 0.485 deaths per 100 million vehicle miles traveled, compared with a national median of approximately 0.322.
The state’s elevated speeding risk coincided with above-median pedestrian and urban roadway fatality rates.
For workers navigating dense traffic environments, these overlapping hazards can create substantial safety concerns.
Road Safety and Financial Protection Remain Interconnected Challenges
Texas Law Dog’s nationwide findings demonstrate that gig and delivery driver safety involves more than the possibility of a collision.
The index identified elevated roadway risks in Arizona, Nevada, South Carolina and several other states, with pedestrian fatalities, cyclist deaths and urban roadway conditions contributing significantly to overall rankings.
Separate occupational injury and worker survey data revealed additional concerns involving medical costs, lost income and insurance coverage.
The findings suggest that reducing the dangers associated with app-based transportation will require attention to several areas:
- Roadway infrastructure: Safer intersections, protected bicycle facilities and improved pedestrian crossings.
- Speed management: Enforcement and roadway designs that reduce dangerous vehicle speeds.
- Delivery operations: More realistic delivery expectations and fewer unnecessary digital interactions while driving.
- Insurance protection: Clearer explanations of when personal, commercial and platform coverage applies.
- Worker safety: Greater attention to occupational injury prevention and the financial consequences of crashes.
As app-based delivery continues expanding, these concerns are likely to remain important for workers, transportation agencies and the communities they serve.
The study’s state rankings provide a framework for identifying where roadway dangers and occupational exposure overlap.
At the same time, the findings demonstrate that crash prevention and financial protection are closely connected challenges for workers who depend on transportation for their livelihoods.
Study Credit: Texas Law Dog.