AP Stats Review Guide: Units, Formulas & Practice 2026
AP stats review is the most important thing you can do in the weeks before the College Board exam in May 2026. AP Statistics tests your ability to explore data, collect it responsibly, apply probability, and draw conclusions using inference.
Whether you are reviewing all 9 units from scratch or doing a final cram before test day, this complete guide covers every unit, every key formula, exam structure, free response strategies, and the best practice resources available in 2026. Use this guide to build confidence and aim for that 5.
AP Stats Exam Quick Facts Table 2026
| Detail | Information |
|---|---|
| Full Exam Name | AP Statistics |
| Administered By | College Board |
| Exam Date (2026) | May 2026 (check College Board for exact date) |
| Total Exam Time | 3 hours |
| Section 1: Multiple Choice | 40 questions, 90 minutes |
| Section 2: Free Response | 6 questions, 90 minutes |
| Free Response Format | 5 short FRQs + 1 Investigative Task |
| Score Range | 1 to 5 |
| Passing Score | 3 or higher |
| Calculators Allowed | Yes (TI-84 recommended) |
| Formula Sheet Provided | Yes (2-sided, College Board issued) |
| Units Covered | 9 units |
| Exam Weight: Inference | ~35–40% of exam |
| Recommended Prerequisite | Algebra II or equivalent |
| College Credit Eligibility | Yes, score of 3, 4, or 5 depending on school |
What Is the AP Stats Exam in 2026?
AP stats review starts with understanding what the exam actually tests. The AP Statistics exam measures your ability to work with real-world data, design studies, apply probability, and use statistical inference to draw conclusions.
The exam has two sections. Section 1 is 40 multiple-choice questions completed in 90 minutes. Section 2 is 6 free-response questions completed in another 90 minutes.
The free-response section includes five shorter questions and one longer Investigative Task. The Investigative Task is worth more points and applies concepts to a new and complex context.

All 9 AP Stats Units: Complete Review
Unit 1: Exploring One-Variable Data
Unit 1 covers how to describe and display a single variable dataset. You need to know how to describe distributions using shape, center, spread, and outliers, a framework sometimes called SOCS.
Key displays include dotplots, histograms, boxplots, and stemplot. You must be able to calculate mean, median, standard deviation, IQR, and percentiles.
For skewed distributions, use median and IQR. For symmetric distributions, use mean and standard deviation. This distinction comes up constantly in AP stats review.
Key concepts include z-scores, normal distributions, and the empirical rule (68-95-99.7). The normal distribution is foundational to everything in the inference units later.
Unit 2: Exploring Two-Variable Data
Unit 2 builds on Unit 1 by examining relationships between two variables. You will work with scatterplots, correlation, and linear regression.
The correlation coefficient r measures the strength and direction of a linear relationship. It ranges from -1 to +1. Always note that correlation does not imply causation.
The least-squares regression line is written as y-hat = a + bx. The slope b tells you how much y is predicted to change for each one-unit increase in x. The y-intercept a is the predicted value of y when x equals zero.
Residual plots are critical. A random scatter of residuals confirms that a linear model is appropriate. A pattern in residuals means a linear model may not be the best fit.
Unit 3: Collecting Data
Unit 3 is about how data is gathered and what conclusions you can draw from different study types. This unit is concept-heavy and shows up frequently in free-response questions.
There are two main types of studies: observational studies and experiments. Observational studies cannot establish cause and effect. Only a well-designed experiment with random assignment can support causation.
Sampling methods include simple random sample (SRS), stratified random sample, cluster sample, and systematic sample. Bias types include voluntary response bias, undercoverage bias, and nonresponse bias.
Experimental design principles are control, randomization, and replication. Blocking reduces variability by grouping similar subjects together before random assignment.
Unit 4: Probability, Random Variables, and Probability Distributions
Unit 4 introduces formal probability rules. You will use the addition rule, multiplication rule, and conditional probability throughout this unit and in later inference units.
A random variable assigns a number to each outcome of a chance process. Discrete random variables have countable outcomes. Continuous random variables take values in a range, like height or weight.
Key distributions to know are the binomial distribution and the geometric distribution. The binomial setting requires a fixed number of trials, two outcomes, independence, and a constant probability of success, summarized as BINS.
The mean and standard deviation of a random variable are calculated using specific formulas provided on the College Board formula sheet. Understanding these formulas is central to your AP stats review.
Unit 5: Sampling Distributions
Unit 5 is often called the bridge between probability and inference. Understanding sampling distributions is absolutely essential for scoring well on the AP stats exam.
A sampling distribution shows the distribution of a statistic (like a sample mean or proportion) across all possible samples of a given size. This is different from the distribution of the original population.
The Central Limit Theorem states that the sampling distribution of the sample mean is approximately normal when the sample size is large enough (n is at least 30 as a general rule). This applies regardless of the shape of the original population.
The standard deviation of the sampling distribution is called the standard error. For sample means it equals sigma divided by the square root of n. For sample proportions it equals the square root of p times (1 minus p) divided by n.
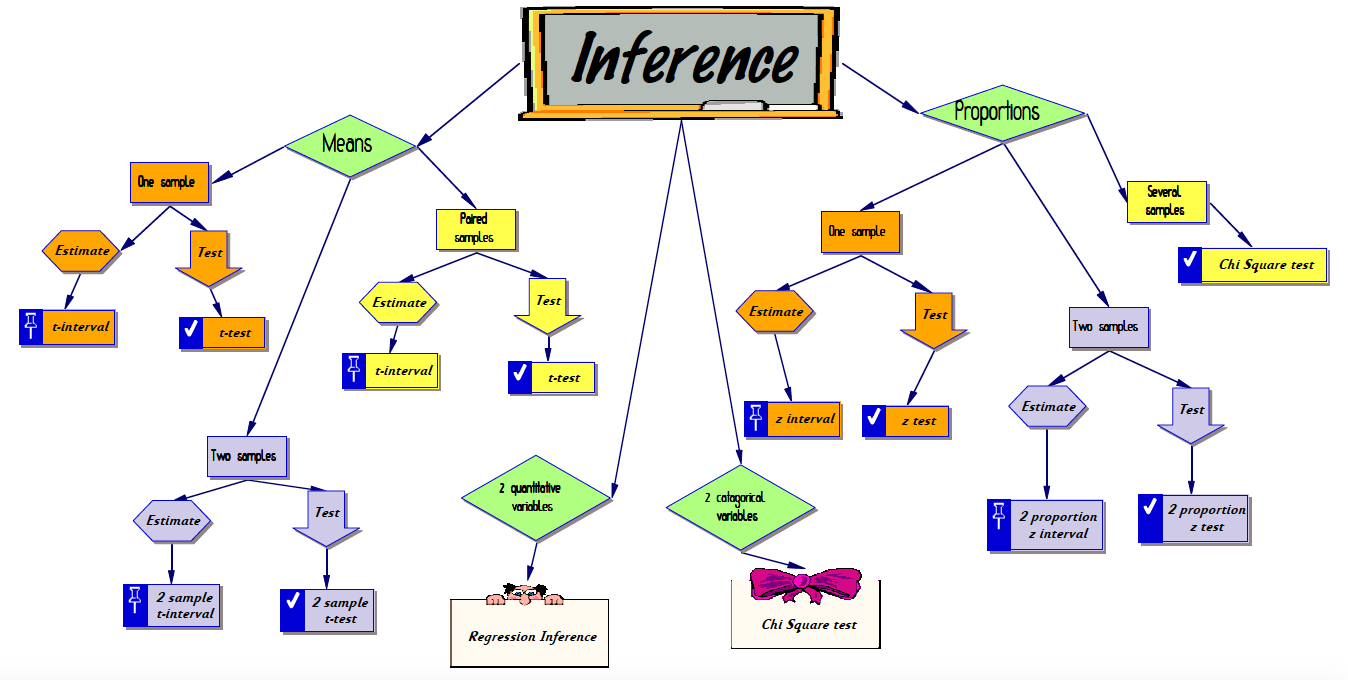
Unit 6: Inference for Categorical Data: Proportions
Unit 6 is where you begin formal inference. You will conduct confidence intervals and hypothesis tests for one proportion and two proportions.
For inference to be valid, three conditions must be met: Random (data comes from a random sample or experiment), 10% (sample size is less than 10% of the population), and Large Counts (expected counts are large enough for normal approximation).
A confidence interval gives a range of plausible values for a population parameter. A 95% confidence interval means that if you repeated the process many times, about 95% of intervals constructed would capture the true parameter.
A hypothesis test uses a z-test statistic and a p-value to decide whether to reject the null hypothesis. The p-value is the probability of getting results as extreme as yours, assuming the null hypothesis is true.
Unit 7: Inference for Quantitative Data: Means
Unit 7 applies inference to means rather than proportions. Here you use the t-distribution instead of the z-distribution because the population standard deviation is usually unknown.
Conditions for inference about means are the same three: Random, 10%, and Normal/Large Sample. The Normal condition requires either a normal population or a sample size of at least 30.
One-sample t-intervals and t-tests are the simplest cases. Paired t-tests are used when you have two related measurements on the same subjects, like pre-test and post-test scores.
Two-sample t-tests compare means from two independent groups. These are common in free-response questions and require careful attention to whether the samples are independent or paired.
Unit 8: Inference for Categorical Data: Chi-Square
Unit 8 introduces three chi-square tests. These are used when you are analyzing count data in categories rather than numerical measurements.
The Chi-Square Goodness of Fit test checks whether observed counts match an expected distribution. The Chi-Square Test for Homogeneity compares distributions of a categorical variable across two or more populations.
The Chi-Square Test for Independence tests whether two categorical variables are associated within a single population. All three share the same test statistic formula but differ in their null hypothesis and setup.
Always calculate expected counts first. Expected counts must all be at least 5 for the chi-square approximation to be valid. Degrees of freedom depend on the number of categories or the dimensions of your table.
Unit 9: Inference for Quantitative Data: Slopes
Unit 9 combines regression from Unit 2 with inference methods. You will test whether the true population slope of a linear relationship is different from zero.
The conditions for inference about slope are often remembered using the acronym LINER: Linear (the true relationship is linear), Independent (observations are independent), Normal (residuals are normally distributed), Equal variance (residuals have consistent spread), and Random (data come from a random process).
A t-test for slope tests whether the slope in the population is zero, meaning no linear relationship exists. A confidence interval for slope gives a range of plausible values for the true population slope.
Understanding output from computer regression printouts is essential in Unit 9. The AP stats exam frequently provides regression output and asks you to interpret the slope, intercept, r-squared, and standard error.
Key AP Stats Formulas to Know for 2026
The College Board provides a two-sided formula sheet at the front of both exam sections. You do not need to memorize every formula, but you must know what each symbol means and when to use each formula.
Here are the most important formulas organized by topic for your AP stats review.
Descriptive Statistics Formulas
Sample mean: x-bar equals the sum of all values divided by n.
Sample standard deviation: s equals the square root of the sum of squared deviations from the mean divided by n minus 1.
Slope of least-squares regression line: b equals r times the ratio of s-y to s-x.
y-intercept of least-squares regression line: a equals y-bar minus b times x-bar.
Probability Formulas
Addition rule: P(A or B) equals P(A) plus P(B) minus P(A and B).
Multiplication rule: P(A and B) equals P(A) times P(B given A).
Conditional probability: P(B given A) equals P(A and B) divided by P(A).
Mean of a discrete random variable: mu equals the sum of x times P(x) for all values.
Sampling Distribution Formulas
Standard error of sample mean: sigma divided by square root of n.
Standard error of sample proportion: square root of p times (1 minus p) divided by n.
Standardized test statistic: z or t equals the statistic minus the parameter divided by the standard error.
Inference Formulas
Confidence interval: statistic plus or minus (critical value times standard error).
z-test statistic for one proportion: z equals p-hat minus p-zero divided by the standard error under the null.
t-test statistic for one mean: t equals x-bar minus mu-zero divided by s over square root of n.
Chi-square test statistic: chi-square equals the sum of (observed minus expected) squared divided by expected.
AP Stats Formula Sheet Tips for 2026
The formula sheet is provided but the variable definitions are not. You must know what every letter and symbol means going into the exam.
Do not wait until the exam to look at the formula sheet for the first time. Use it throughout your AP stats review so that finding formulas becomes fast and automatic.
Reference the formula sheet on every practice problem where a formula applies. Annotate your personal copy with notes about when to use each formula and what the variables mean.
How to Approach Multiple Choice Questions
Multiple choice on the AP stats exam has 40 questions worth 50% of your score. Each question has five answer choices and there is no penalty for guessing.
The most common trap in multiple choice is confusing correlation with causation, confusing confidence level with probability, or misinterpreting what a p-value means. Know these distinctions cold before test day.
Work through each question by eliminating obviously wrong answers first. When two answers look similar, focus on the exact statistical language. AP stats questions are very precise in their wording.
How to Score High on Free Response Questions
Free response makes up 50% of your score. The first five questions are shorter and each usually targets a specific unit. The Investigative Task at the end is longer and worth more points.
Write complete sentences and always use context. The AP stats graders require context for full credit. If a question asks about the slope of a regression line, your answer must mention the actual variables by name.
Show every step. State the name of the test or interval. Check all conditions. Show your calculation. Write a conclusion in context with your significance level. Missing any of these steps costs points even if your math is correct.
Best AP Stats Review Resources for 2026
Choosing the right resources makes your AP stats review faster and more effective. Here are the top options organized by type.
For free official materials, the College Board website has released complete exams from 1997 and 2012, plus over 20 years of free-response questions with scoring guidelines. These are the most accurate practice materials available.
For structured video review, Khan Academy has a full AP Statistics course aligned to all 9 units. Each video is short and concept-focused, making it easy to target weak areas quickly.
Fiveable offers unit summaries, cheat sheets, and guided practice specifically built for the 2026 AP stats exam. Their formula sheet PDF covers the entire course on one page and is very popular among students who are crunched for time.
Albert.io provides extensive multiple-choice and free-response practice with detailed explanations. It is one of the best paid options for students who want exam-style practice questions beyond what College Board releases.
The Ultimate Review Packet by Bryan Passwater includes unit-by-unit practice FRQs with answer keys and an exam simulator. It is widely used by AP stats teachers and students for structured review.
4-Week AP Stats Review Study Plan
Having a plan turns random studying into focused preparation. Here is a realistic 4-week AP stats review schedule for the weeks leading up to the May 2026 exam.
Week 1 covers Units 1 through 3. Focus on describing distributions, regression, and study design. Do 10 multiple-choice questions and one practice FRQ per day.
Week 2 covers Units 4 and 5. Focus on probability rules, random variables, and sampling distributions. These units are foundational to inference and deserve extra attention.
Week 3 covers Units 6 through 9. Work through all four inference frameworks: proportions, means, chi-square, and slopes. Use condition checklists and practice writing full conclusions in context.
Week 4 is full exam simulation. Take at least two complete timed practice exams. Review every mistake. Revisit the formula sheet daily. Use your remaining time to strengthen whatever unit still feels weakest.
Common AP Stats Mistakes to Avoid
The most common mistake in AP stats is misinterpreting what a p-value means. A p-value is not the probability that the null hypothesis is true. It is the probability of observing results as extreme as yours, assuming the null is true.
Another frequent error is forgetting to check conditions before performing inference. Graders on free-response questions require you to explicitly verify Random, 10%, and Normal/Large Counts conditions before any calculation.
Many students lose points by writing conclusions that do not include context. Every conclusion on the AP stats exam must reference the actual variables from the problem, not just generic statistical language.
AP Stats Calculator Tips for 2026
The TI-84 is the standard calculator for AP stats and virtually every function you need is built in. Know how to run one-proportion z-tests, two-proportion z-tests, t-tests, chi-square tests, and linear regression from the STAT menu.
When you use a calculator on free response, you must still show your work. Write down the name of the test, the test statistic, the degrees of freedom, and the p-value. Never just write a p-value with no context.
Practice using the calculator throughout your ap stats review so that navigating the menus feels automatic. On test day you cannot afford to waste time hunting through calculator menus.
AP Stats Score Distribution and What a 5 Takes
In recent years, approximately 15 to 20 percent of students who take the AP Statistics exam earn a 5. About 25 to 30 percent earn a 4. A score of 3 earns college credit at many institutions.
To earn a 5 you need strong performance across both sections. A rough estimate is that scoring about 75 to 80 percent correct on multiple choice and earning high marks on all FRQ components gets you to that top range.
The Investigative Task is often where strong students separate themselves. It requires connecting multiple statistical concepts and applying them to an unfamiliar scenario, exactly the kind of deep understanding that good ap stats review builds.
AP Stats vs AP Calculus: Which Is Harder?
Many students choosing between AP Stats and AP Calculus wonder which is more difficult. AP Statistics is non-calculus-based, which means there is no derivatives, integrals, or limits involved.
However, AP Stats requires strong conceptual thinking and precise communication. The exam is not just math computation. You have to write clear, accurate statistical conclusions and understand the logic behind every procedure.
AP Calculus may feel more mechanical once you master the rules. AP Stats requires you to think carefully about meaning, context, and interpretation in every single problem.
Who Should Take AP Statistics?
AP Statistics is a strong choice for students who plan to study social sciences, psychology, business, biology, public health, economics, or any field that uses data analysis.
It is also excellent preparation for students who want to build quantitative reasoning skills without taking calculus. The concepts learned in AP stats review directly apply to college courses across many majors.
Students comfortable with Algebra II who enjoy reasoning through real-world problems tend to thrive in AP Statistics. The course rewards careful thinkers more than fast calculators.

Frequently Asked Questions
What is AP stats review and where should I start?
AP stats review is a systematic study of all 9 College Board units before the May exam. Start with your weakest unit, use the official formula sheet, and practice writing free-response answers in full sentences with context.
How many units are in AP Statistics?
AP Statistics has 9 units covering exploring data (Units 1 and 2), collecting data (Unit 3), probability and distributions (Units 4 and 5), and inference (Units 6 through 9). Inference units make up the largest portion of the exam.
Is a formula sheet provided on the AP stats exam?
Yes, College Board provides a two-sided formula sheet at the start of both exam sections. It includes descriptive statistics, probability, sampling distribution, and inference formulas. Variable definitions are not included so you must know them.
What is the best AP stats review resource in 2026?
The best free resources are College Board’s released exams and Khan Academy. For structured paid practice, Albert.io and the Ultimate Review Packet are the top choices. Fiveable’s cheat sheet PDF is popular for quick last-minute review.
How long is the AP Stats exam?
The AP Stats exam is 3 hours total. Section 1 is 40 multiple-choice questions in 90 minutes. Section 2 is 6 free-response questions including one Investigative Task, also in 90 minutes.
What score do you need to get a 5 on AP Stats?
Roughly 75 to 80 percent of total available points earns a 5 in most exam years. About 15 to 20 percent of test takers score a 5. Strong performance on free response, especially the Investigative Task, is essential for reaching that top score.
What are the hardest units in AP Statistics?
Most students find Unit 5 (Sampling Distributions) and Units 6 through 9 (Inference) the most challenging. These units require understanding conditions, interpreting results in context, and writing complete statistical conclusions rather than just computing answers.
Can I use a graphing calculator on the AP Stats exam?
Yes, a graphing calculator is required for the AP Stats exam. The TI-84 Plus is the most commonly used. Know how to perform all major tests and intervals from the STAT menu before exam day.
How should I study for AP Stats free response questions?
Practice writing complete responses using the PANIC or PHANTOM frameworks for every inference procedure. Always check conditions, show calculations, and write conclusions in context. Review College Board’s released FRQs with scoring guidelines to understand exactly what earns full credit.
Is AP Statistics worth taking in high school?
Yes, AP Statistics is worth taking for most students. It builds genuine data literacy, may earn college credit, and directly applies to courses in nearly every major. It is accessible without calculus and rewards strong reasoning and communication skills.
Conclusion
AP stats review in 2026 is about building a complete understanding of all 9 units, mastering the formula sheet, and practicing how to communicate statistical reasoning clearly and accurately.
From describing data distributions in Unit 1 to running inference for slopes in Unit 9, every topic connects to the bigger picture of how statisticians draw meaningful conclusions from real-world data.
Use the study plan, formula summaries, and resource recommendations in this guide to prepare with purpose. Start early, practice free response every week, and approach each practice exam as a learning opportunity.
With consistent effort and the right approach, scoring a 4 or 5 on the AP Stats exam in 2026 is completely within reach.