Poker Stats: Track Wins, Hands & Player Performance 2026
Poker stats are the backbone of every winning player’s strategy in 2026. Whether you play cash games online, grind MTTs, or sit down at a live table, your numbers tell the truth that memory never can.
From VPIP and PFR to BB/100 and WTSD, understanding and tracking the right poker statistics separates disciplined winners from recreational players who run on instinct alone.
What Are Poker Stats and Why Do They Matter?
Poker stats are numerical measurements of how you and your opponents play over a sample of hands. They convert behavior at the table into objective data that can be analyzed, compared, and acted upon.
Every decision you make at the poker table — whether to raise, fold, call, or check — gets recorded as a data point. Over thousands of hands, these data points form a clear picture of your strengths, weaknesses, and leaks.
Without tracking your poker stats, you’re relying on memory, which is unreliable and biased. Winning players use data. Losing players use gut feelings.
The Most Important Poker Stats Explained
The Core Preflop Stats Every Player Needs
The foundation of any poker stats system starts before the flop. Preflop decisions affect every hand you play, which is why preflop stats have the most data and the most predictive power.
The five most critical poker stats to track — supported by the top 8 ranked competitors — are VPIP, PFR, AF, 3Bet%, and ATS. These five stats, viewed together, tell you almost everything about a player’s fundamental style within 100 hands.
VPIP — Voluntarily Put Money In Pot
VPIP measures how often a player voluntarily puts money into the pot before the flop. It includes calls, raises, limps, and 3-bets but excludes forced blinds and antes.
VPIP is the single most important poker stat. A low VPIP (under 15% in full ring, under 20% in 6-max) indicates a tight player. A high VPIP (over 40%) almost always signals a recreational “fish” who plays too many hands.
VPIP Benchmarks by Game Format:
| Player Type | Full Ring VPIP | 6-Max VPIP | Interpretation |
|---|---|---|---|
| Super Nit | Under 10% | Under 15% | Only plays premium hands |
| Tight-Aggressive (TAG) | 12–18% | 18–25% | Winning standard |
| Loose-Aggressive (LAG) | 20–28% | 25–35% | Advanced winning style |
| Loose Passive (Fish) | 30–50%+ | 35–55%+ | Recreational / losing player |
| Maniac | 60%+ | 60%+ | Highly unpredictable |
The ideal VPIP for a winning player depends heavily on stake and format. At micro stakes, a tighter range (15–22% in 6-max) is more profitable. At higher stakes, wider ranges with better post-flop execution become viable.
PFR — Pre-Flop Raise
PFR measures how often a player raises before the flop. PFR is always lower than or equal to VPIP — if you call without raising, the VPIP goes up but PFR stays the same.
The gap between VPIP and PFR tells you how passive or aggressive a player is. A small gap (VPIP 20%, PFR 17%) means the player is aggressive and rarely limps. A wide gap (VPIP 35%, PFR 8%) means the player limps frequently — a significant leak.
Winning players typically maintain a VPIP/PFR gap of no more than 5–7 percentage points. A gap over 10 usually signals a limping problem.
AF — Aggression Factor
AF (Aggression Factor) measures post-flop aggression. It compares how often a player bets or raises versus calls. The formula is: (Raises + Bets) / Calls.
An AF of 1.0 means equal aggression and passivity. An AF of 2.0 or higher indicates a player who bets and raises twice as often as they call post-flop. Winning players at most stakes fall between AF 2.0 and AF 4.0.
A very high AF (above 5) with a small sample size is unreliable. Always wait for at least 100 hands before drawing conclusions from AF.
3Bet% — Three-Bet Percentage
3Bet% tracks how often a player re-raises when facing a pre-flop raise. This stat identifies aggressive regulars and helps you adjust ranges against them.
For full ring games, a 3Bet% of 3–5% is considered standard. For 6-max games, 5–10% is typical for a solid winning player. A 3Bet% under 3% means the player almost never 3-bets without a premium hand. A 3Bet% over 12% signals an aggressive bluffer.
Knowing a player’s 3Bet% lets you decide how wide to call or fold against their pre-flop pressure, and when their range is strong versus polarized.
ATS — Attempt to Steal
ATS measures how often a player raises from the cutoff, button, or small blind when folded to. It directly reflects how aggressively a player steals the blinds.
A winning player typically attempts to steal 25–45% of the time from late position. If a player has an ATS under 20%, they are leaving significant money on the table by not pressuring the blinds enough.
Position-specific ATS stats are far more useful than the overall number. A player might have a low overall ATS but steal aggressively from the button — which is a completely different profile than a player who never steals from any position.
Essential Postflop Poker Stats
C-Bet — Continuation Bet
C-Bet (Continuation Bet) measures how often a player bets the flop after being the pre-flop aggressor. It is one of the most commonly tracked postflop poker stats.
Winning players typically c-bet between 50% and 75% of the time on the flop. A c-bet frequency above 80% means a player is over-betting and becoming exploitable. A frequency below 40% usually signals excessive passivity.
C-bet stats are also tracked by street — flop c-bet, turn c-bet (also called double barrel), and river c-bet (triple barrel). Each carries different strategic implications.
WTSD — Went to Showdown
WTSD measures the percentage of flops seen that result in a showdown. It tracks how often a player continues through a hand all the way to the cards being revealed.
A WTSD of 27–32% is the target for most winning players. A higher WTSD (above 35%) often means a player is calling too much post-flop and losing chips in bad spots. A lower WTSD (under 24%) might mean over-folding or running too many successful bluffs.
WTSD requires a large sample size — aim for at least 8,000 hands before using this stat to make significant adjustments to your game plan.
W$SD — Won Money at Showdown
W$SD measures how often a player wins money when a hand reaches showdown. Unlike a simple win/loss stat, W$SD captures partial wins — even if you win less than you invested, it still counts.
Winning players typically have a W$SD between 52% and 66%. A W$SD above 66% often means a player is bluffing too infrequently. A W$SD below 49% suggests they are bluffing too often or calling with weak hands.
W$SD is best read alongside WTSD. A low WTSD paired with a high W$SD tells you a player reaches showdown rarely but almost always with the best hand.
WWSF — Won When Saw Flop
WWSF measures how often a player wins a pot after seeing the flop. It captures both showdown wins and non-showdown wins — pots won by forcing folds post-flop.
A WWSF between 45% and 53% is standard for winning players. A WWSF above 53% suggests high post-flop aggression and successful bluffing. A WWSF below 42% may indicate a player who is too passive post-flop and gives up pots too easily.
WWSF is closely tied to your “redline” — the line on your winnings graph that represents non-showdown winnings. Building a positive redline requires winning pots without showdowns, which directly improves WWSF.
Win Rate Poker Stats: Measuring Long-Term Profitability
BB/100 — The Core Win Rate Stat
BB/100 measures how many big blinds you win (or lose) per 100 hands. It is the primary metric for judging long-term cash game profitability and is supported by every major tracking tool.
A BB/100 of 0 means you are breaking even. Any positive number represents a winning player. Any negative number means you are losing money long-term.
BB/100 Benchmarks by Stake and Format:
| Win Rate | Category | What It Means |
|---|---|---|
| Below 0 BB/100 | Losing Player | Adjustments needed immediately |
| 0 – 2 BB/100 | Break-Even | Slight winner; variance is a factor |
| 2 – 5 BB/100 | Solid Winner | Good regular at current stake |
| 5 – 10 BB/100 | Strong Winner | Consider moving up stakes |
| 10+ BB/100 | Elite Winner | Crushing current stake level |
A sample of at least 50,000–100,000 hands is needed before BB/100 accurately reflects skill rather than short-term variance.
Showdown vs. Non-Showdown Winnings
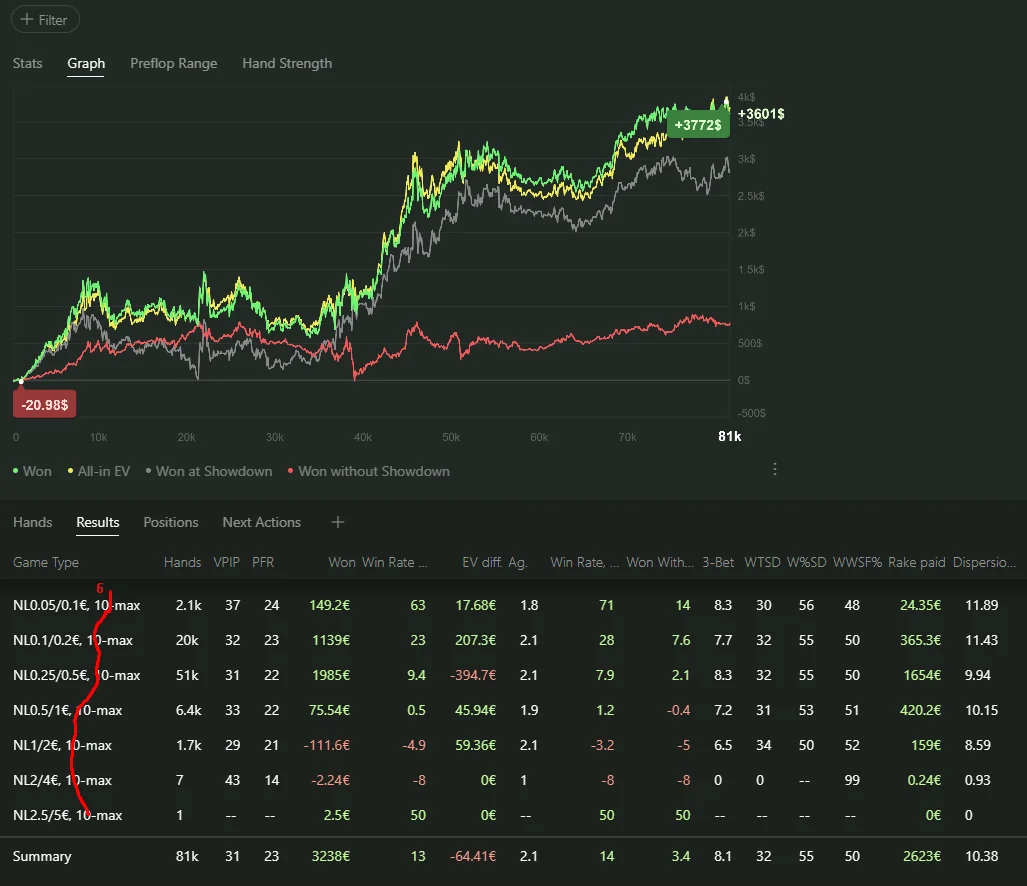
Every tracking tool separates your total winnings into two lines on a graph: showdown winnings (bluelineF) and non-showdown winnings (redline).
Your bluelineF tracks money won at showdowns. Your redline tracks money won without reaching showdown — through successful bluffs, steals, and continuation bets that go uncalled.
Most winning players have a positive bluelineF and a flat or slightly negative redline. Elite aggressive players maintain a positive redline by winning many pots without showdown. If your redline is sharply negative, you are giving away too much money by folding to pressure post-flop.
Hourly Rate for Live Poker Players
For live poker players, BB/100 is still relevant but the more practical metric is hourly rate. Live games deal significantly fewer hands per hour (25–30) compared to online (60–100+), so tracking dollars per hour is more actionable.
Record every session’s buy-in, cash-out, hours played, and game type. After 200+ hours, your hourly rate becomes statistically meaningful. Consistent positive hourly numbers confirm you belong at a stake; declining numbers signal tilt, game selection issues, or a skill gap.
How to Track Your Poker Stats: Tools and Methods
Poker Tracking Software (Online Players)
Online players benefit enormously from dedicated poker stats software. The industry standard tools are PokerTracker 4 (PT4) and Hold’em Manager 3 (HM3) — both of which automatically import hand histories from supported poker sites.
Both tools provide a real-time HUD that overlays player stats directly on your table. You see an opponent’s VPIP, PFR, 3Bet%, and other key stats sitting right next to their seat as you play.
Hand2Note is a third alternative popular for its highly customizable HUD and deep stat filtering options, particularly suited for players who want granular positional breakdowns.
Poker Tracking Software Comparison:
| Tool | Best For | HUD | Price Model | Platform |
|---|---|---|---|---|
| PokerTracker 4 | All-round tracking | Yes | One-time fee | Windows / Mac |
| Hold’em Manager 3 | Cash game depth | Yes | Subscription | Windows |
| Hand2Note | Advanced customization | Yes | Subscription | Windows |
| Poker Copilot | Mac users | Yes | One-time fee | Mac / Windows |
| Poker Analytics | Live game tracking | No | One-time fee | iOS |
Excel Poker Spreadsheets (Live and Online Players)
For live players — or online players on sites that don’t support hand history exports — a poker spreadsheet is the next best option. Excel or Google Sheets can store session data, calculate win rate, and chart trends over time.
At minimum, log the date, game type, buy-in, cash-out, hours played, and location. More advanced spreadsheets include notes on significant hands, position-specific results, and stake-level performance across different months.
The key discipline is logging results immediately after every session — not at the end of the week from memory. Accuracy decays fast, and distorted records lead to distorted conclusions.
Poker Session Tracking Apps
Apps like Poker Analytics (iOS), Poker Income, and Bankroll Poker offer mobile-friendly session tracking for live players who want more than a spreadsheet but don’t need full software tracking.
These apps record session data, calculate hourly rate and total profit, generate charts, and allow for quick hand notes. They’re particularly useful for recording hands at the table on a phone during play, then reviewing later at home.
Poker Stats by Game Format
Cash Game Stats
Cash games reward consistent, exploitable play based on poker stats. BB/100 is the primary metric. Tracking by position, stake, and blind level reveals whether your edge is position-specific or consistent across the entire table.
Key cash game stats to prioritize: VPIP, PFR, AF, 3Bet%, fold to 3Bet, c-bet, fold to c-bet, WTSD, W$SD, and WWSF. These 10 stats give you a complete picture of your own tendencies and your opponents’ habits.
The most common leaks in cash game stats: a VPIP/PFR gap above 8 (too much limping), an AF below 1.5 (too passive post-flop), a WTSD above 35% (calling too much), and a BB/100 below 0 after 30,000+ hands.
Tournament (MTT) Stats
Tournament poker stats focus on different metrics than cash games because the chip stack dynamics and payouts change strategy dramatically.
Key MTT stats include: ITM% (in the money percentage), ROI% (return on investment), final table rate, average finish position, and buy-in level win rate. Most tournament databases use tools like SharkScope to track these across thousands of tournament results.
ITM% targets vary by field size. For large MTTs (100+ players), an ITM% of 18–22% is solid. ROI% above 20% across a large sample (500+ tournaments) indicates a profitable MTT player.
Sit-and-Go (SNG) Stats
SNG poker stats prioritize ROI% and ITM% over BB/100. Because SNGs have fixed buy-ins and standardized payout structures, tracking ROI across a large volume is the most accurate measure of edge.
The ICM (Independent Chip Model) factor makes SNG stats distinct. A player might have a strong chip win rate but poor ROI because of poor push/fold decisions when the bubble and prize structure change chip values dramatically.
For SNG players, specialized tools like Poker Spin Tracker for Spin & Go formats provide the most relevant stat breakdowns by stack depth and stage of the tournament.
6-Max vs. Full Ring Stats
Six-max and full ring games produce significantly different optimal stat ranges. Understanding the difference is essential for any player who switches between formats.
6-Max vs. Full Ring Benchmark Comparison:
| Stat | 6-Max Winning Range | Full Ring Winning Range |
|---|---|---|
| VPIP | 20–28% | 14–20% |
| PFR | 16–24% | 10–16% |
| 3Bet% | 6–10% | 3–6% |
| ATS | 28–45% | 20–35% |
| AF | 2.5–4.5 | 2.0–3.5 |
| WTSD | 25–32% | 26–32% |
| W$SD | 52–60% | 52–62% |
| BB/100 (good reg) | 4–8 BB | 3–6 BB |
The core reason for the differences: six-max has more hands per orbit, forcing looser hand selection and more aggressive stealing. Full ring allows tighter ranges because there are more players to act after you.
How to Use Poker Stats to Find and Fix Leaks
What Is a Poker Leak?
A poker leak is any recurring pattern in your poker stats that costs you money over time. Leaks are usually invisible without tracking — they hide inside hands that feel fine in the moment but add up to consistent losses.
Common leaks revealed by poker stats: limping too often (high VPIP/PFR gap), c-betting too frequently (c-bet above 80%), calling too much post-flop (high WTSD), and failing to steal blinds (low ATS from late position).
Leak-finder tools built into PT4, HM3, and Poker Copilot automate this process. They flag specific stats that fall outside winning player ranges and suggest targeted adjustments.
Sample Size: Why It Matters More Than Results
One of the most misunderstood aspects of poker stats is sample size. Short-term results — even over thousands of hands — do not reliably reflect skill. Variance can make a losing player look like a winner for 20,000 hands and make a winning player look like a loser for 10,000.
For reliable BB/100 data, aim for 50,000–100,000 hands minimum. For VPIP and PFR, 500–1,000 hands gives a stable read. For WTSD and W$SD, you need 8,000+ hands before the numbers are actionable.
Never make major strategy overhauls based on small samples. Let the data accumulate before drawing conclusions.
Position-Specific Stats: The Hidden Edge
Most players look at overall poker stats without breaking them down by position. This is a missed opportunity. Winning players maintain entirely different VPIP and PFR numbers from each seat at the table.
A TAG player might show an overall VPIP of 20% but have a button VPIP of 35% and a UTG VPIP of 10%. This positional awareness is the mark of a skilled player — and it shows up directly in the data.
Breaking your stats down by position (early, middle, late, blinds) reveals exactly where you’re leaking chips and which positions are your most profitable. Most tracking software provides this breakdown automatically.
Advanced Poker Stats in 2026
GTO vs. Exploitative Stats
In 2026, poker strategy increasingly blends GTO (Game Theory Optimal) concepts with exploitative adjustments. Your poker stats tell you which approach to apply against which opponent.
Against a player with a 90% VPIP and 3% PFR, GTO balance is irrelevant — exploit the imbalance with thinner value bets and fewer bluffs. Against a regular with VPIP 22/PFR 19/3Bet 8%, you need a more balanced, GTO-aware approach to avoid being exploited yourself.
The stats guide the strategy. Without them, you’re making decisions in the dark.
Redline Improvement Strategies
The redline — your non-showdown winnings trend — is the most discussed advanced concept in modern poker stats analysis. A flat or negative redline is acceptable at low stakes. A sharply negative redline at higher stakes often becomes a critical problem.
To improve your redline, focus on: increasing c-bet frequency in position, floating and raising bluffs more frequently post-flop, and applying more turn and river pressure rather than giving up on missed draws.
Players with strong redlines win pots without needing to show the best hand — which dramatically increases overall profitability at mid and high stakes.
Poker Stats Benchmarks: Complete Winning Player Reference
![]()
Use this table as a quick reference for your own poker stats analysis:
Complete Winning Player Poker Stats Reference (6-Max NL Hold’em):
| Stat | Leak (Problem) | Target Range | Elite Level |
|---|---|---|---|
| VPIP | Under 16% or over 32% | 20–28% | 22–26% |
| PFR | Under 14% or over 25% | 17–23% | 18–22% |
| VPIP/PFR Gap | Over 8% | Under 5% | Under 3% |
| 3Bet% | Under 4% or over 14% | 6–10% | 7–9% |
| Fold to 3Bet | Over 70% or under 40% | 50–65% | 55–62% |
| AF | Under 1.5 or over 6.0 | 2.0–4.5 | 2.5–3.5 |
| C-Bet Flop | Under 40% or over 85% | 55–75% | 60–70% |
| C-Bet Turn | Under 35% or over 75% | 45–65% | 50–60% |
| WTSD | Over 36% or under 22% | 27–32% | 28–31% |
| W$SD | Under 48% or over 68% | 52–60% | 54–58% |
| WWSF | Under 42% or over 55% | 46–52% | 48–51% |
| BB/100 | Negative | 3–8 BB | 8–15+ BB |
Frequently Asked Questions (FAQs)
What are poker stats?
Poker stats are numerical measurements of playing patterns tracked over thousands of hands. They include metrics like VPIP, PFR, BB/100, and WTSD that reveal how you and your opponents make decisions at the table.
What is VPIP in poker stats?
VPIP stands for Voluntarily Put Money In Pot and measures how often a player enters a pot before the flop. A VPIP of 20–28% is the target range for a winning 6-max player in 2026.
What is a good BB/100 win rate?
A BB/100 of 3–5 is solid for a regular winning player at most stakes. A BB/100 above 8–10 indicates you are crushing your current stake and should consider moving up to a higher level.
What is the best software to track poker stats?
PokerTracker 4 and Hold’em Manager 3 are the industry leaders for online tracking. Mac users prefer Poker Copilot. Live players rely on Poker Analytics (iOS) or a custom Excel spreadsheet for session logging.
How many hands do I need before my poker stats are reliable?
VPIP and PFR stabilize after 500–1,000 hands. BB/100 requires 50,000–100,000 hands for accuracy. WTSD and W$SD need at least 8,000 hands before they become meaningfully actionable.
What is the difference between WTSD and W$SD?
WTSD measures how often you reach showdown after seeing the flop. W$SD measures how often you win money when you do reach showdown. Both stats are used together to identify whether you call too much or bluff too little.
What is the redline in poker stats?
The redline is your non-showdown winnings graph line — it tracks money won without reaching showdown through bluffs, c-bets, and steals. A strongly positive redline indicates high post-flop aggression and profitable bluffing.
Should I use a HUD to track poker stats in 2026?
Yes — a HUD (Heads-Up Display) overlays opponent stats in real time during online play. It is one of the strongest edges available to online players in 2026 and is allowed on most major poker platforms.
What poker stats should beginners focus on first?
Beginners should start with VPIP, PFR, and BB/100. These three stats reveal the most about playing style and profitability. Once these are understood and optimized, expand to AF, 3Bet%, WTSD, and W$SD.
How do live poker players track their stats without software?
Live players use mobile apps like Poker Analytics or custom spreadsheets to log session data after each game. Track date, game type, buy-in, result, hours played, and significant hands — then review monthly for trends.
Conclusion
Poker stats are not optional for serious players in 2026 — they are the foundation of every improvement decision you make. VPIP and PFR define your pre-flop identity.
AF and c-bet frequency reveal your post-flop aggression. WTSD, W$SD, and WWSF tell you whether you’re calling too much, bluffing too little, or folding equity you should be winning. BB/100 ties it all together into a single honest verdict on your long-term profitability.
The players who track poker stats consistently outperform those who don’t — not because the numbers play the cards, but because the numbers identify leaks that are invisible during live play. One corrected leak worth 1 BB/100 compounds into thousands of dollars over 100,000 hands.
Start tracking every session. Review your poker stats weekly. Fix one leak at a time. The data already knows where you’re losing — your job is to listen to it.