AP Stats Study Guide: Key Concepts & Practice 2026
AP Stats study guide searches spike every spring for good reason — the AP Statistics exam is one of the most concept-dense, reasoning-heavy tests in the entire AP program, and students who walk in without a structured review plan almost always underperform.
What Is AP Statistics and Why It Matters in 2026
AP Statistics is a college-level introductory statistics course designed to teach students how to collect, analyze, and draw meaningful conclusions from data. It mirrors the content of a typical first-semester college stats course.
A score of 3 or higher on the AP Stats exam can earn you college credit at thousands of universities, potentially saving you a full semester of tuition. Scores of 4 or 5 significantly broaden that credit eligibility.
Beyond credit, AP Stats builds foundational skills in probability, data analysis, and statistical reasoning that directly support careers in medicine, psychology, economics, data science, engineering, and social research.
AP Statistics Exam Format 2026 — What to Expect
The AP Stats exam is a 3-hour exam with two equal parts. Section I has 40 multiple-choice questions completed in 90 minutes. Section II has six free-response questions completed in 90 minutes — five standard FRQs plus one longer investigative task.
You are allowed to use a graphing calculator throughout the entire exam. A formula sheet with statistical tables is provided, so memorizing every formula verbatim is less critical than knowing how and when to apply them.
AP Stats Exam Structure at a Glance
| Section | Format | Questions | Time | Weight |
|---|---|---|---|---|
| Section I | Multiple Choice | 40 questions | 90 minutes | 50% |
| Section II | Free Response | 5 standard + 1 investigative | 90 minutes | 50% |
| Total | — | 46 questions | 3 hours | 100% |
The investigative task in Section II is typically longer and worth more points than the five standard FRQs. It tests your ability to synthesize multiple statistical concepts into one extended response.
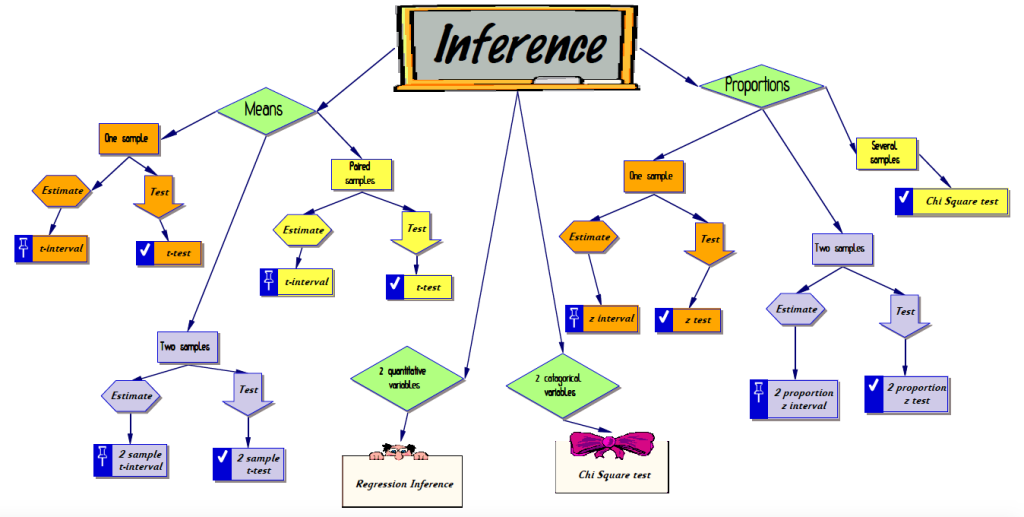
The 9 Units of AP Statistics — Complete Breakdown
The College Board organizes AP Statistics into nine units. Your AP stats study guide needs to cover all nine with the right time allocation based on how heavily each unit is tested.
Unit 1 — Exploring One-Variable Data (15–23% of Exam)
This is the biggest unit by exam weight and should anchor your early review. You will describe distributions, calculate measures of center and spread, and interpret graphs.
Key topics include categorical vs. quantitative variables, frequency tables, bar charts, dot plots, histograms, box plots, mean, median, standard deviation, IQR, percentiles, z-scores, and the normal distribution.
The normal distribution is especially important. Know how to use z-scores to find areas under the normal curve and how to apply the empirical rule (68-95-99.7 rule).
Unit 2 — Exploring Two-Variable Data (5–7% of Exam)
This unit focuses on relationships between two variables. You will analyze scatterplots, calculate correlation, and fit least-squares regression lines.
Key topics include direction, form, and strength of association; correlation coefficient r; least-squares regression line equation; residuals and residual plots; coefficient of determination r²; and transformations for non-linear data.
A common mistake: students confuse correlation with causation. Always frame your conclusions carefully in context. The AP exam will penalize you for overstating what a correlation proves.
Unit 3 — Collecting Data (12–15% of Exam)
This unit covers how studies and experiments are designed. Questions here test vocabulary and conceptual reasoning more than calculation.
Key topics include census vs. sample, observational study vs. experiment, simple random sample, stratified random sample, cluster sample, systematic sample, voluntary response bias, convenience sample, confounding variables, randomization, control groups, blinding (single and double-blind), placebo effect, and blocking.
A key principle: only a properly designed randomized experiment can establish causation. Observational studies can only show association, never cause-and-effect.
Unit 4 — Probability, Random Variables, and Distributions (10–20% of Exam)
Probability is where many students struggle the most. This unit requires both conceptual understanding and careful calculation.
Key topics include basic probability rules, complement rule, addition rule, multiplication rule, conditional probability, independence, mutually exclusive events, discrete and continuous random variables, expected value (mean), variance, standard deviation of random variables, binomial distributions, and geometric distributions.
A critical skill: recognizing when to use the binomial distribution (fixed n, binary outcomes, independent trials, constant p) versus the geometric distribution (counting trials until the first success).
Unit 5 — Sampling Distributions (7–12% of Exam)
Sampling distributions are the conceptual bridge between probability and inference. Many students underestimate this unit’s importance.
Key topics include the sampling distribution of the sample mean, sampling distribution of the sample proportion, Central Limit Theorem (CLT), standard error, and the conditions required for inference.
The Central Limit Theorem states that for large enough samples (n ≥ 30 for means), the sampling distribution of the sample mean is approximately normal regardless of the shape of the population distribution.
Unit 6 — Inference for Categorical Data: Proportions (12–15% of Exam)
This unit introduces formal statistical inference using proportions. It is one of the highest-yield units on the exam.
Key topics include one-sample z-test for a proportion, one-sample z-interval for a proportion, two-sample z-test for the difference between proportions, two-sample z-interval for the difference between proportions, and the four-step inference procedure: State, Plan, Do, Conclude (SPDC).
Always verify the three conditions before running any inference procedure: Random (data must come from a random sample or randomized experiment), Normal (sample large enough to use normal approximation), and Independent (10% condition: sample is less than 10% of population).
Unit 7 — Inference for Quantitative Data: Means (10–18% of Exam)
This is parallel to Unit 6 but uses t-procedures instead of z-procedures, because population standard deviation is usually unknown.
Key topics include one-sample t-test for a mean, one-sample t-interval for a mean, two-sample t-test for the difference between means, two-sample t-interval, and paired t-procedures for matched pairs designs.
The t-distribution has heavier tails than the normal distribution and requires degrees of freedom (df = n − 1 for one-sample). As sample size increases, the t-distribution approaches the normal distribution.
Unit 8 — Inference for Categorical Data: Chi-Square (2–5% of Exam)
The chi-square procedures test for relationships between categorical variables and how well observed data fits a theoretical model.
Key topics include chi-square goodness-of-fit test, chi-square test for homogeneity, chi-square test for independence/association, expected cell counts, and degrees of freedom for chi-square tests.
The chi-square statistic measures how far observed counts deviate from expected counts. A large chi-square value means a large discrepancy — and a small p-value.
Unit 9 — Inference for Quantitative Data: Slopes (2–5% of Exam)
This final unit extends linear regression into formal inference, testing whether a linear relationship between two variables actually exists in the population.
Key topics include the t-test for the slope of a regression line, confidence interval for the slope, conditions for inference on slopes, and computer regression output interpretation.
Computer output is frequently tested. You need to recognize standard error, the t-statistic, p-value, and confidence interval directly from a regression output table without doing the calculations by hand.
AP Stats Unit Weight Summary Table
| Unit | Topic | Exam Weight |
|---|---|---|
| Unit 1 | Exploring One-Variable Data | 15–23% |
| Unit 2 | Exploring Two-Variable Data | 5–7% |
| Unit 3 | Collecting Data | 12–15% |
| Unit 4 | Probability, Random Variables & Distributions | 10–20% |
| Unit 5 | Sampling Distributions | 7–12% |
| Unit 6 | Inference for Proportions | 12–15% |
| Unit 7 | Inference for Means | 10–18% |
| Unit 8 | Chi-Square Tests | 2–5% |
| Unit 9 | Inference for Slopes | 2–5% |
Key AP Statistics Formulas to Know
You will receive a formula sheet on exam day, but knowing what the formulas mean and when to use each one is far more important than memorizing them cold.
Descriptive Statistics Formulas
- Sample Mean: x̄ = (Σx) / n
- Sample Standard Deviation: s = √[Σ(x − x̄)² / (n − 1)]
- Z-Score: z = (x − μ) / σ
- IQR: IQR = Q3 − Q1
- Outlier Boundaries: Lower = Q1 − 1.5(IQR), Upper = Q3 + 1.5(IQR)
Probability Formulas
- Addition Rule: P(A or B) = P(A) + P(B) − P(A and B)
- Multiplication Rule (Independent): P(A and B) = P(A) × P(B)
- Conditional Probability: P(A | B) = P(A and B) / P(B)
- Expected Value: μ = Σ[x · P(x)]
- Binomial Mean: μ = np
- Binomial Standard Deviation: σ = √(np(1−p))
Inference Formulas
- Confidence Interval: statistic ± (critical value)(standard error)
- Test Statistic: z or t = (statistic − parameter) / (standard error)
- Standard Error for Proportion: SE = √[p̂(1 − p̂) / n]
- Standard Error for Mean: SE = s / √n
The Four-Step Inference Framework (SPDC)
Every free-response question involving inference — confidence intervals and hypothesis tests — should follow the same four-step structure. AP scorers award points for each step independently.
Step 1 — State: Define your parameter in context. “Let p = the true proportion of all [population] who [action].” Identify whether you are constructing a confidence interval or performing a significance test. State your hypotheses (H₀ and Hₐ) for hypothesis tests.
Step 2 — Plan: Name the inference procedure (“one-sample z-interval for a proportion”). Check all three conditions: Random, Normal, and Independent. Show your work checking each one.
Step 3 — Do: Perform the calculation. Write out your formula, plug in numbers, and state the result. For confidence intervals: (lower bound, upper bound). For hypothesis tests: test statistic and p-value.
Step 4 — Conclude: Write a conclusion in context at the significance level. “Because p-value [</>] α = 0.05, we [reject / fail to reject] H₀. We [do / do not] have convincing evidence that [Hₐ in context].”
Skipping any of these four steps costs you points. Even if your calculation is wrong, a complete framework earns partial credit.
Common AP Statistics Mistakes to Avoid
Understanding what trips students up is just as important as knowing the content itself. Here are the highest-frequency errors on AP Stats free-response questions.
Failing to check conditions. Every inference procedure requires three conditions to be verified: Random, Normal, and Independent. Writing “conditions are met” without showing work earns zero credit for that step.
Wrong conclusion language. After a hypothesis test, you “fail to reject” the null — never “accept” the null. This is a critical vocabulary distinction that AP scorers look for specifically.
Confusing confidence level with probability. A 95% confidence interval does not mean “there is a 95% probability the parameter is in this interval.” The correct interpretation: “We are 95% confident that the true parameter is captured by this interval.”
Ignoring context. Every conclusion on the AP exam must be stated in the context of the problem. Generic conclusions lose points regardless of whether the math is correct.
Using z when you should use t. When the population standard deviation σ is unknown (almost always in practice), use t-procedures. Only use z for proportions or when σ is explicitly given.
Forgetting degrees of freedom. For t-procedures, df = n − 1 for one-sample tests. For chi-square goodness-of-fit, df = number of categories − 1. For chi-square tests of independence, df = (rows − 1)(columns − 1).
AP Stats Study Plan — 3-Month Schedule
The ideal AP Stats study plan starts at the beginning of January for the May exam. Here is how to allocate your time across a 12-week schedule.
| Weeks | Focus | Daily Time |
|---|---|---|
| Weeks 1–2 | Units 1–2: Exploring Data, Regression | 30–45 min |
| Weeks 3–4 | Unit 3: Collecting Data, Experimental Design | 30–45 min |
| Weeks 5–6 | Unit 4: Probability and Distributions | 45–60 min |
| Week 7 | Unit 5: Sampling Distributions + CLT | 45–60 min |
| Weeks 8–9 | Units 6–7: Inference for Proportions and Means | 60 min |
| Week 10 | Units 8–9: Chi-Square, Inference for Slopes | 45 min |
| Week 11 | Full Practice Exams + FRQ Timed Practice | 60–90 min |
| Week 12 | Light Review, Formula Sheet, Past FRQs | 30–45 min |
Spend at least 45–60 minutes every day in the final two months before the exam. Consistent study sessions are more effective than cramming. Practice FRQs frequently, especially those covering frequently tested questions, and keep track of concepts you have trouble with.
AP Stats Study Plan — 1-Month Crash Course
If you have only four weeks before the May exam, here is a focused, high-efficiency schedule that prioritizes the highest-weight units.
| Week | Focus | Strategy |
|---|---|---|
| Week 1 | Units 1, 3, 4 (highest weight) | Review notes + 20 MCQs daily |
| Week 2 | Units 5, 6, 7 (inference core) | 10 MCQs + 2 FRQs daily |
| Week 3 | Full practice exam + FRQ writing | Full timed Section II daily |
| Week 4 | Weak areas + formula sheet review | Past AP FRQs only |
The most time-efficient approach is to spend the majority of Week 3 and Week 4 on free-response practice, since FRQs simultaneously test content from multiple units and force you to write complete, reasoned responses.
How to Answer AP Statistics Free-Response Questions
Free-response scoring is all about complete communication. AP readers are trained to award credit based on what is written on the page — nothing more.
Always define your parameters before starting inference. Never assume the reader knows what your symbols mean. Write “Let μ = the true mean exam score for all students at [school]” before writing any formula.
Show every step of checking conditions even when they seem obvious. If you write “The sample is random” without citing evidence from the problem, you will not earn that condition point.
Write your conclusion sentence last and make sure it includes the decision, the significance level, and the context. “Since p-value = 0.034 < α = 0.05, we reject H₀. There is convincing evidence that the true proportion of defective items exceeds 5%.”
For the investigative task — the sixth free-response question — read the entire prompt before writing anything. This task is multi-part and requires synthesizing several statistical methods. Outline your approach before writing.
Best AP Statistics Resources for 2026
Choosing the right prep materials separates students who improve by 1 point from students who leap from a 2 to a 5. Here are the most effective resources organized by type.
Official College Board Resources
The College Board releases free practice FRQs from previous AP Statistics exams at apcentral.collegeboard.org. These are the single most accurate representation of what you will see on May 7, 2026. Work through at least five full years of past FRQs with the official scoring guidelines.
Download the AP Statistics Course and Exam Description (CED) from the College Board website. This document contains every testable skill and learning objective with examples. Your review plan should map directly to the CED.
Third-Party Study Resources
| Resource | Type | Best For |
|---|---|---|
| UWorld AP Statistics | Question bank + explanations | High-quality MCQ and FRQ practice |
| Barron’s AP Statistics | Review book | Full content coverage |
| Khan Academy AP Statistics | Free video + practice | Visual learners, concept review |
| Princeton Review AP Statistics | Review book | Test strategies and quick review |
| Fiveable AP Stats | Notes + practice | Unit summaries and cheat sheets |
| Math Medic AP Stats | Free lessons | Concept-first understanding |
Calculator Skills
The TI-84 Plus is the most commonly used graphing calculator for AP Stats. Know these operations cold: computing summary statistics (1-Var Stats), creating histograms and boxplots, running normcdf and invNorm for normal distribution problems, binompdf and binomcdf for binomial distribution, t-tests and z-tests (from the STAT > TESTS menu), and constructing confidence intervals directly from the calculator.
Calculator keystrokes are not awarded points on AP Stats — only setup, conditions, and conclusions earn credit. But knowing your calculator saves enormous time on the multiple-choice section.
AP Statistics Vocabulary — High-Yield Terms
Mastering statistical vocabulary is non-negotiable. The AP exam regularly asks you to define terms, identify procedures by name, and use precise language in your free-response answers.
| Term | Definition |
|---|---|
| Parameter | A numerical summary of a population |
| Statistic | A numerical summary of a sample |
| Bias | Systematic error that consistently over- or under-estimates the true value |
| Confounding variable | A variable related to both the explanatory and response variables |
| Power | Probability of correctly rejecting a false null hypothesis |
| Type I Error | Rejecting H₀ when H₀ is actually true |
| Type II Error | Failing to reject H₀ when H₀ is actually false |
| P-value | Probability of observing results as extreme as the sample if H₀ is true |
| Confidence level | Long-run proportion of intervals that capture the true parameter |
| Standard error | Estimated standard deviation of a sampling distribution |
| Degrees of freedom | Number of values free to vary in a statistical calculation |
| Lurking variable | An unobserved variable that influences the relationship between two others |
| Placebo effect | Improvement in outcomes due to belief in treatment, not the treatment itself |
| Regression to the mean | Extreme values tend to be followed by less extreme values |
| Residual | Actual value minus predicted value (y − ŷ) |
Understanding P-Values Correctly
The p-value is the single most misunderstood concept in AP Statistics, and misinterpreting it is one of the most common ways students lose points on the exam.
A p-value is the probability of observing data as extreme as — or more extreme than — what was collected, assuming the null hypothesis is true. It is not the probability that the null hypothesis is true.
When p-value < α (usually 0.05), you reject H₀ and conclude you have convincing statistical evidence for Hₐ. When p-value ≥ α, you fail to reject H₀ — but you do not conclude H₀ is true. Failing to reject simply means the data did not provide enough evidence against H₀.
A small p-value does not prove practical significance. A study with n = 10,000 can produce a statistically significant result for a tiny, meaningless effect. Always interpret results in context.
Normal Distribution and Z-Scores — Core Review
The normal distribution underlies most of AP Statistics, from z-scores in Unit 1 to sampling distributions in Unit 5 to z-procedures in Unit 6.
A normal distribution is symmetric and bell-shaped, fully described by its mean (μ) and standard deviation (σ). The empirical rule tells you that approximately 68% of values fall within 1σ of the mean, 95% within 2σ, and 99.7% within 3σ.
A z-score measures how many standard deviations an individual value falls from the mean: z = (x − μ) / σ. Positive z means above the mean; negative z means below.
To find areas under the normal curve, use the standard normal table (provided) or the normalcdf function on your graphing calculator. Know how to work in both directions: finding probabilities from z-scores and finding z-scores from percentiles (using invNorm).
Confidence Intervals vs. Hypothesis Tests — Key Differences
Students often confuse confidence intervals and hypothesis tests because both are inference procedures. Here is a clear comparison.
| Feature | Confidence Interval | Hypothesis Test |
|---|---|---|
| Purpose | Estimate the true parameter | Make a decision about H₀ |
| Output | A range of plausible values | A test statistic and p-value |
| Interpretation | “We are [C]% confident that…” | “Because p < α, we reject / fail to reject…” |
| Decision | No formal accept/reject | Formal decision rule using α |
| Tells You | Where the parameter likely is | Whether the parameter differs from a claim |
Both procedures require the same conditions (Random, Normal, Independent) and the same four-step SPDC framework. The calculations differ, but the logic is parallel.
How AP Statistics Is Scored — Points and Grades
The AP Statistics exam is scored on a scale of 1–5. Here is a general breakdown of how raw points translate to final scores.
| AP Score | Meaning | College Credit Likelihood |
|---|---|---|
| 5 | Extremely well qualified | Almost always |
| 4 | Well qualified | Usually |
| 3 | Qualified | Often (varies by school) |
| 2 | Possibly qualified | Rarely |
| 1 | No recommendation | Never |
The multiple-choice section counts for 50% of the total score. Each of the 40 questions is worth the same amount, and there is no penalty for guessing — always answer every question.
The free-response section counts for the other 50%. The five standard FRQs are each worth about 7.5% of the total score. The investigative task is worth about 12.5%. Writing complete, justified responses matters enormously in this section.
Test Day Strategy for AP Statistics
Arriving on exam day prepared with strategy — not just content — is what separates 4s from 5s on AP Statistics.
For multiple-choice: work at a pace of about 2 minutes per question. Skip questions that are immediately confusing and return to them after finishing the rest of the section. Eliminate obviously wrong answers before guessing.
For free-response: read every question fully before writing. Allocate roughly 12 minutes per standard FRQ and about 25 minutes for the investigative task. Write your parameter definitions, conditions, and conclusions clearly even if you are unsure of the calculation — partial credit is real and significant.
Never erase a correct step because you are unsure about a later step. AP readers cannot unscore points you have already earned. If you make an error midway through an FRQ, carry it forward correctly (“if my answer above had been X, then…”) for potential carried-forward credit.
Frequently Asked Questions (FAQs)
What is the best AP Stats study guide for 2026?
The best AP Stats study guide for 2026 combines official College Board practice FRQs with a structured content review book like Barron’s or UWorld and daily timed practice to build exam stamina and accuracy.
How hard is the AP Statistics exam compared to other AP exams?
AP Stats is considered moderately difficult — harder than AP Psychology but easier than AP Calculus BC. The challenge lies in precise language, careful reasoning, and applying statistical concepts to new contexts rather than memorizing formulas.
What percentage of students score a 5 on AP Statistics?
Approximately 16–19% of AP Statistics test-takers earn a 5 in a typical year, with around 60% scoring 3 or above, making it one of the more passable AP exams with proper preparation.
When is the AP Statistics exam in 2026?
The AP Statistics exam date for 2026 is May 7, 2026. It is a hybrid digital exam where students complete multiple-choice in Bluebook and write free-response answers in paper booklets.
How many units are in AP Statistics?
AP Statistics has nine units covering exploring one-variable data, two-variable data, collecting data, probability, sampling distributions, inference for proportions, inference for means, chi-square tests, and inference for slopes.
What formulas are given on the AP Statistics exam?
The College Board provides a formula sheet with key formulas for descriptive statistics, probability, sampling distributions, confidence intervals, and test statistics. Knowing when and how to apply each formula matters more than memorizing them.
How long should I study for the AP Statistics exam?
For most students, 8–12 weeks of structured daily study (30–60 minutes per day) is sufficient to target a 4 or 5. A one-month crash course focusing on high-weight units and FRQ practice can still produce a 3 or 4.
What are the most important topics to study for AP Stats?
The highest-weight topics are Unit 1 (Exploring One-Variable Data, 15–23%), inference for proportions (Unit 6, 12–15%), inference for means (Unit 7, 10–18%), and probability (Unit 4, 10–20%) — together covering roughly 60–70% of all exam questions.
Can I use a calculator on the AP Statistics exam?
Yes. A graphing calculator is permitted throughout the entire AP Statistics exam, including both the multiple-choice and free-response sections. The TI-84 Plus is the most widely used and supported model.
What is the difference between a Type I and Type II error in AP Stats?
A Type I error is rejecting a true null hypothesis (false positive), with probability equal to α. A Type II error is failing to reject a false null hypothesis (false negative), with probability called β, and its complement is the power of the test.
Conclusion
AP Stats study guide strategies that actually work all share the same foundation: deep conceptual understanding, consistent free-response practice, and precise statistical language.
The 2026 AP Statistics exam rewards students who can do three things well — choose the right procedure, verify the right conditions, and write the right conclusion in context. No formula sheet in the world substitutes for that.
Use this guide to work through all nine units systematically, prioritize the highest-weight topics, and spend the final three to four weeks doing nothing but timed free-response practice with official College Board scoring guidelines.
A score of 4 or 5 is absolutely achievable with the right preparation, and the skills you build along the way will serve you in every data-driven course and career that follows.